HiKorea, your favorite website that you probably dread having to use, has an interesting new interactive map that collects tons of big data info into a fun browsable interface. From here, you can view all kinds of statistics on foreigners living around the country, narrowing down data points to specific regions and even visa types. Let's take a look at some examples of the data you can find here.
 |
| Korean Immigration Office's Big Data Analysis & Visualization Tool (이민행정 빅데이터 분석·시각화) |
How to access the data map
To find it, go to the main menus section of the HiKorea website, and go to <정보광장>, then look down to find the entry for <빅데이터 분석·시각화>.
It's circled on the image below:

There's also a direct link here:
🔗 https://hikorea.go.kr/bix5/shares/4dfcf20b67bb00809e7b4ee7ca5b71b1
The page will open with some general data figures from the UN about immigration and foreigners worldwide.
 |
| General worldwide data provided by UN |

Examples of data on foreigners in Korea
|
| Resident foreigners in Korea data portal |
From here we can tap various provinces in Korea to see a wealth of immigration data on them. For one example, we can use the red graphs to see what proportions each country of origin make up for foreigners residing in that region.
Seoul vs Geyongsangdo
So for example, here's a comparison of Seoul's foreigners (left) and Gyeongsang-do (-bukdo and -namdo, right).
 |
| Foreign population makeup, Seoul vs. Gyeongsangdo |
Lowest concentration of foreigners
What if I am sick of foreigners completely? What's the area of Korea with the least foreigners altogether?
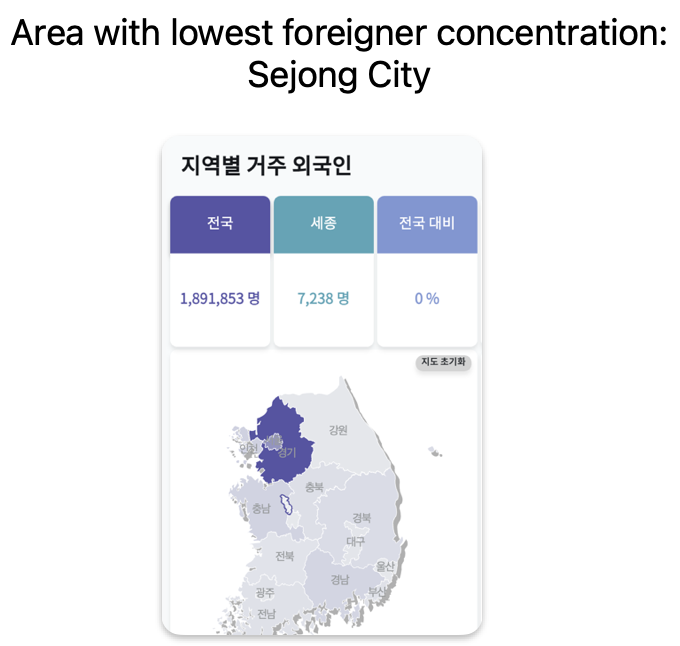 |
| Sejong City: foreigner free! |
Not surprising if you think about it: it's Sejong City, the new administrative capital and home to an army of civil service bureaucrats who, surprise surprise, are comprised of essentially 100% native Koreans.
Gangwondo foreigners
 |
| Gangwondo foreigner stats |
Let's take a peek at the stats for Gangwondo just for fun.
Where do most Gangwondo foreigners live?

Answer: Wonju. Followed by Chuncheon and Gangneung. Not surprising really: the same stats are probably true for where native Koreans in Gangwondo mostly live too.
 |
| More foreigner statistics from Gangwon-do |
Like other rural areas of Korea, immigrants from Vietnam make up the lion's share of foreigners in Gangwondo, with Korean-Chinese, Chinese, and Nepalese rounding out the rest. Americans show up in that #5 spot.
Overall foreigner types in Korea
 |
| Residency visa status of foreigners in Korea |
- F-4 (Overseas Korean) - 28%
- E-9 (Non-professional industry, construction, agriculture, etc) - 16%
- F-5 (Permanent resident) - 10%
- D-2 (Student) - 8%
- F-6 (Marriage visa) - 7%
- F-1 (Family visa) - 5%
- H-2 (Work-and-visit visa) - 5%
- D-4 (Training, Language study) - 3%
- F-2 (Other long term resident) - 2%
- G-1 (Misc) - 2%
Comments